
Resources & Instructions
Read through these instructions to find out how to complete the project. They include links to helpful videos that show you how to use the software. If you have any problems, look at the Help & Support page.
1. Download the folder of Gaia data. The folder contains 17 images taken by Faulkes Telescope North. This is a large zip file so may take a minute or so to download. Once it has been downloaded, you will need to right-click on the folder and extract all the contents. Save the folder of extracted files somewhere you can easily find them again.
2. Make sure you know how to use JS9 and MS Excel before continuing! Look through the JS9 Manual and watch the screencasts.
3. Open JS9. This should open in whichever browser you are using.
4. Open and view a data file using JS9. The file name tells you the date the image was taken (20160302 = 2016, March 2nd). Adjust the contrast of the image to reveal the details.
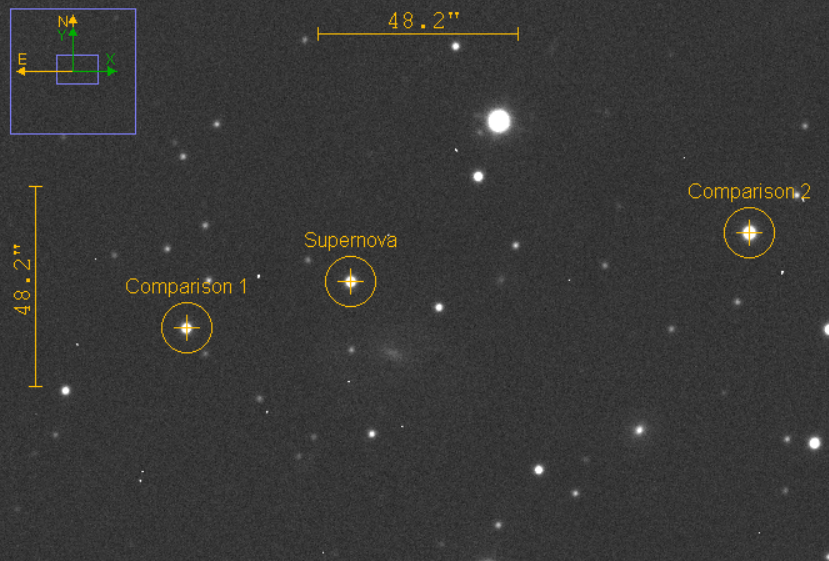
comparison stars
5. Use the Finder Chart on this page to locate the target supernova, Gaia16agf. You also need to find the 2 suggested comparison stars. You may need to zoom in or out and move around the image.
6. Do photometry (measure the brightness) on the 3 objects you have located. Export the data containing the Star Brightness, Sky Median, and Number of pixels for each. You will need this information for the next step!
7. Use the Magnitude calculator spreadsheet to add your data to the light curve.
8. Repeat steps 4 - 7 for each of the 17 images. For each image, it is important to use the same size aperture and the same size annulus for your photometry measurements.
9. You'll see your light curve appear in the graph at the bottom of the spreadsheet!
10. Measure the peak value of your light curve.