
Collect your data
We suggest you start by using data from stars in the open cluster NGC 957. This data is part of a test dataset taken by Faulkes Telescope North.
- You should use aperture photometry to measure the colour and brightness of as many stars as possible.
- You must measure the brightness of each star in both the B-filter file and the V-filter files.
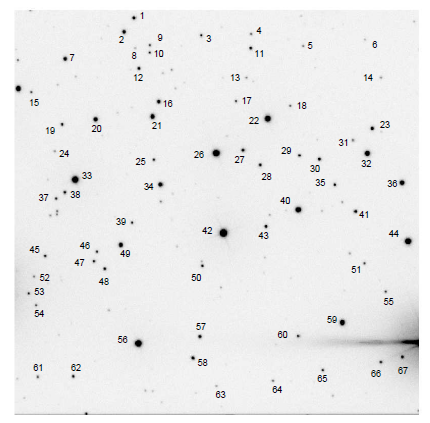
- Make sure to measure the same stars in the same order in each file - the finder chart will help you to do this.
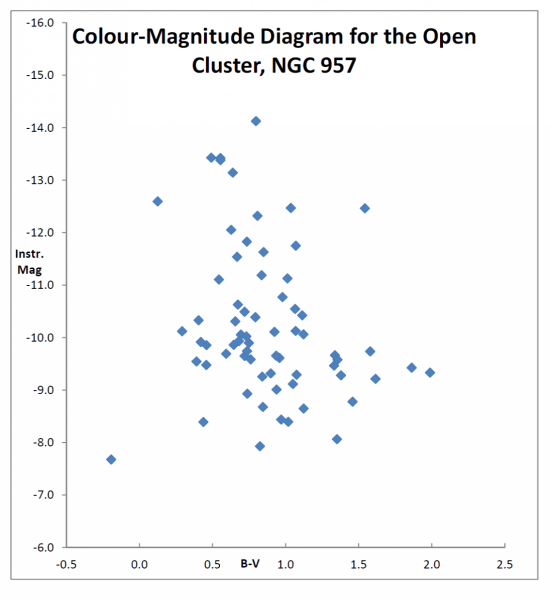
- You can then export your data to a spreadsheet, and use it to create a colour-magnitude diagram.
You will need:
- the finder chart (click to open png file)
- NGC957 B-band FITS file (2 MB)
- NGC957 V-band FITS file (2 MB)
- image processing software like Makali'i
- a spreadsheet package like MS Excel
Learn more about:
Once you have created your colour-magnitude diagram, you may wish to compare it with our version on this page. If your plot looks similar, you can be confident to proceed with some other datasets.
Get more datasets from open clusters
You may also want to look at data from 47 Tuc. This is a globular cluster. You should notice that this cluster contains many more stars, much more densely packed together. Take a small area of the 47Tuc data and complete the photometry in the same way as you would with an open cluster. Think about differences in where the data falls on the colour-magnitude diagram.
47 Tuc V-band FITS file (20 MB)
47 Tuc B-band FITS file (20 MB)
Credit: Fraser Lewis, Faulkes Telescope Project
Credit: Fraser Lewis, Faulkes Telescope Project
Do some background research
Process your data using Makali'i