
Plot Your Data
Using a .csv File
The 'Aperture Photometry' box within Makali'i gives you a lot of information in a layout that isn't particularly easy to read. It is much easier to use a spreadsheet like Excel. You can easily export your data as a .csv file. Use the [Print] button within the 'Aperture Photometry' box. Choose your file format type and save your data.
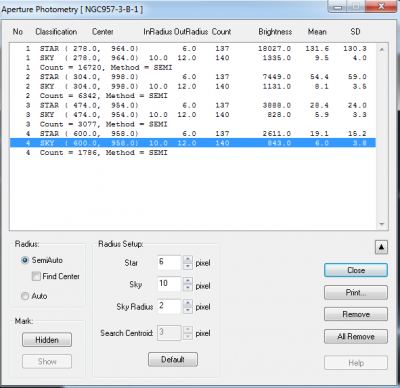
Credit: Fraser Lewis, Makali'i (NOAJ)
Use Excel to open your .csv files. All your data will be presented neatly in columns. Please bear in mind these instructions below screenshots from Microsoft Excel 2010. Different versions of Excel will have slightly different layouts.
The data you have exported contains the brightness of the stars as well as the brightness of the sky around them. You should have two sets of data for the same stars: a set from the B filter and a set from the V filter.
For each file, there are only a few columns you need to use to create a colour-magnitude diagram. These are:
- A - Number - ideally, this will match the star numbers in the finder chart
- B, C - Obj X, Obj Y - these are the X and Y coordinates for your star
- Q - Result Count - this is the number of counts for a given star
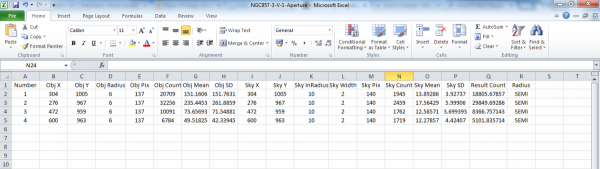
Credit: Fraser Lewis
The numbers in the B and C columns for each file should look similar. In theory, they should give the same coordinates for the same star. If they differ by more than a few pixels, it might be worth checking your measurements. You may not have chosen the same stars in the same order for each filter.
The only other reason these columns might not be identical is that the telescope may have drifted slightly between the two exposures. For example, star 1 in the V-band image may have coordinates 304, 1005 whereas the B-band image may show as 304, 998.
Another thing to check at this stage is that both of your files contain the same number of rows of data. If they don't, you have not measured the same set of stars in each filter.
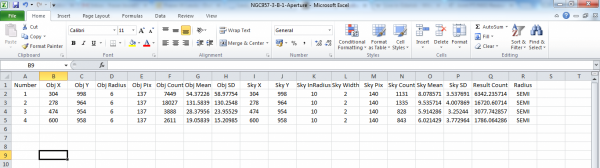
Credit: Fraser Lewis
If you are confident you have measured the same stars in the same order for both filters, you are now ready to start work on your data.
Calculating Magnitudes
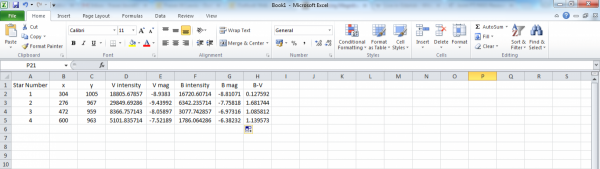
Your data will give the brightness of the star as an intensity value in pixel counts. You need to convert each value to a magnitude for both filters using this formula:
Magnitude = - 2.5 * log (counts/exposure time)
You can find the exposure time for each file in the FITS header.
You may want to open a new sheet and copy and paste in only the data you need for this calculation. You will then be able to work with data from both files in one sheet.
If you are unfamiliar with using formulas in Excel, there is more information on the Microsoft support website.
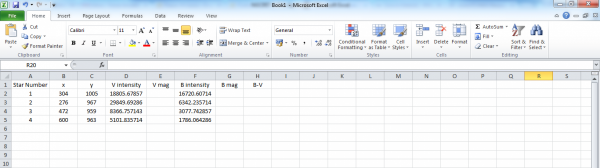
Credit: Fraser Lewis
Calculating the colour value
The B-V colour index is a way of quantifying the colour of a star. You can work it out using this formula:
B-V colour = B magnitude - V magnitude
Credit: Fraser Lewis
Making Your CMD
Once you have worked out the magnitude and colour of all of your stars, you can plot the data on a scatter chart to create a colour-magnitude diagram. The V-band magnitude should be on the y-axis and the B-V value should be on the x-axis.
Bear in mind that magnitudes use an unusual scale. The lower (or more negative) the value the brighter the object is. You will need to reverse the values of the y-axis. You can do this by right-clicking on the y-axis, selecting the 'Format Axis' option, clicking the 'Scale' tab, and checking the 'Values in reverse order' box.
You can now analyse your plot to see if you can see regions of main-sequence stars or the giant branch.
If you are having trouble making your graph in Excel, you can upload your data here and the website will do the work for you.
Add error bars to your data.
Draw some conclusions.